

Use Chrome Developer Tools to fix render-blocking code
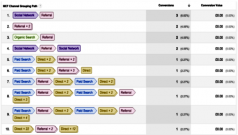
If you've tested your website with the Google PageSpeed Insights tool - you've done that, right? - one of the results you got was probably similar to this:
The top row in that graphic shows in time-lapse how a browser renders this page. The 5 empty boxes on the left show a period of time during which a user isn't yet seeing any content in the page; then various elements start to become visible.
As in this example, it's common for the PageSpeed Insights tool to point out an opportunity for improving loading speed by eliminating render-blocking resources like non-critical JavaScript and CSS.
In the example to follow, I'll show you how to use Google's Chrome Developer Tools to identify render-blocking CSS, and the effect eliminating non-essential CSS elements had on the PageSpeed Insights results.
Note that you'll need to use a recent version of the Chrome browser in order to replicate my example.
The Opportunity shown in the graphic above came from running PageSpeed Insights on the home page of ACROGlobal.com which in my Chrome Version 80.0.3987.149 looks like this:
To get started on a fix, I opened Chrome Developer Tools starting from the 3-dot "hamburger" icon at the top right of Chrome:
On the first fly-out menu click More tools, then on the second click Developer tools. On the ACROGlobal.com home page, that opens a screen like this:
I've chosen to check the stylesheet acroglobalnew.css for non-critical code. First thing to do at this screen is to go to the Sources tab (1), then from the various sources listed across the top select acroglobalnew.css (2), then click the Developer Tools hamburger icon at top right (3) in order to reveal the Run command option (4).
Clicking Run command opens this window:
In the top field (which opens empty) start keying in the word "coverage" and that will reveal the various choices below it.
Clicking on Drawer Show Coverage opens at the bottom of the screen a view of acroglobalnew.css (you can see a fragment in the screencap below) along with the Reload Button:
Clicking the Reload Button opens this view of acroglobalnew.css :
Note the red and green vertical bars that Developer Tools have added on the left side.
The green bars indicate CSS elements that ACROGlobal.com/index.htm needs to render correctly.
The red bars indicate CSS elements that are not used in the HTML code of ACROGlobal.com/index.htm.
Aha! So all we have to do to speed this website up is to open acroglobalnew.css in our HTML editor and delete anything that Developer Tools marked in red, right?
No. Don't do that yet. Because the results we have are based on index.htm only and other pages may need some of the styles marked in red.
First, make a backup of the stylesheet you're working on - in this case acroglobalnew.css.
Then edit one copy to remove elements that were marked in red, and upload to replace the original version.
Check index.htm to see if anything is broken. (Should not be.) My page still worked fine.
Then check other pages, starting with the most important. I found that I had to put back into the stylesheet one set of hyperlink styles that are needed by some other pages.
Then to see if all this had any effect on PageSpeed Insight results, I re-ran that tool. Opportunities now looked like this:
After fixing CSS, eliminating render-blocking resources dropped from Opportunity #1 to #2, and potential speed gain dropped from 1.44 seconds to 0.47 seconds - a reduction of nearly a full second in loading time.
And considering that before changes, loading speed of this page was only 2.4 seconds to First Contentful Paint and 3.5 seconds to Interactive, eliminating unused CSS produced a nearly 28% reduction in loading Time to Interactive.
Required some work, but not bad for a free tool!
 - David


Comments on Load pages faster by eliminating render-blocking resources